Table of contents
Open Table of contents
Introduction
More often that usual you’ll hear quite the talk about the importance of observability and the need to catch all golden signals to help you build the knowledge about your infrastructure, your apps and how they behave to answer questions like:
- when action X happend ?
- Who did the action ?
- How many unauthorized actions were executed this particular week ?
In a cloud-native environments, such public cloud AWS, GCP Azure, OVH, Scaleway or even on-promise VMs it is such a crucial pilar to understand everything that goes in & out, to catch inbound & outbound traffic so that you can react proactively.
The bottom line is that you don’t want to fly blind, which mean obersvability is your golden tool, but what does it mean ?
Observability is the capability to continuously generate and discover actionable insights based on signals from the system under observation, with the goal of influencing the system.
You probably came across the term monitoring, which could make it slightly confusing, think of it as a tiny piece of observability, more about workload health and performance.
Still too dark ? let’s have some real use cases to really grasp the goal:
- understanding code changes as a developer, you often add a new feature or fix bugs in your code base. How do you understand the impact of these code changes? What are the relevant data points you need to assess the effects, such as slower execution or more resource usage?
- understanding third-party dependencies, you may use things that are outside of your control—for. How do you know they are performing as they intended ?
- measuring user experience a developer, site reliability engineer (SRE), or operator, you want to make sure your app or service is responsive and reliable. How and where do you measure this ?
- tracking health and performance, you want to be able to understand the health of your workloads, which can include the overall uptime, the response time distribution, and the parties impacted by a partial or full outage.
- blast radius analysis, how can you tell whether an error is in your app or in the Kubernetes data plane or VM ?
- optimizing a service as a developer, you want to carry out optimizations, including performance, resource usage & response time of your workloads.
- auditing access and tracking compliance, i can’t stress this enough, but you really want to keep track of who has access to different services and customer data.
Signals
Signals are bread and butter of observability, we can seperate a signal:
- based on numerical value: for instance RAM usage in KB
- based on textual content: workload’s log line
In this article we’ll be focusing on logs, a textual representation of what’s happening in the workload, be it an error or a successful execution of a payment …Etc. the log line should be structured & timestamped to help us correlate with different signals out there, consuming logs comes in different shapes, mainly searching events.
Logs have different levels:
- trace: really verbose output to help developers understand what’s going on with each call and track different actions.
- debug: slightly less verbose than Trace, but serves same purpose.
- info: log a successuful action executed.
- warn: something concerning but not blocking, probably it needs your attention, e.g: badly configured heap memory, bad value that defaulted to some value …etc.
- error: an exception was thrown and you’ll need to analyse it ASAP, e.g: database down and transactions are failing apart …etc.
And several standards/formats :
- Syslog
- Apache CLF: Apache Common Log Format
- JSON:
- Binary: for instance journald & systemd
A piece of advice when writing your logs, think of these points:
-
context: always make it clear when logging, it’s all about pieces of data you include to give clear insights.
-
Always log to STDOUT, specially in the context of cloud native apps, this helps tools read and forward your logs toward different destinations, you can read more about it in the Twelve app factor
-
labels: adding labels to your log help parsers, users and tools (promtail, fluentd, fluentbit …etc.) deferentiate quickly and easily different events, for instance in golang you can use logrus library:
import (log "github.com/sirupsen/logrus")...// set JSON formatlog.SetFormatter(types.JSONFormatter)// log with labelslog.WithFields(logrus.Fields{"app_name": AppName,"correlation_id": correlationID,"user": metadata.User,"ip_address": metadata.IPAddress,"method": metadata.Method,"path": metadata.Path,}).Info("Incoming X query")
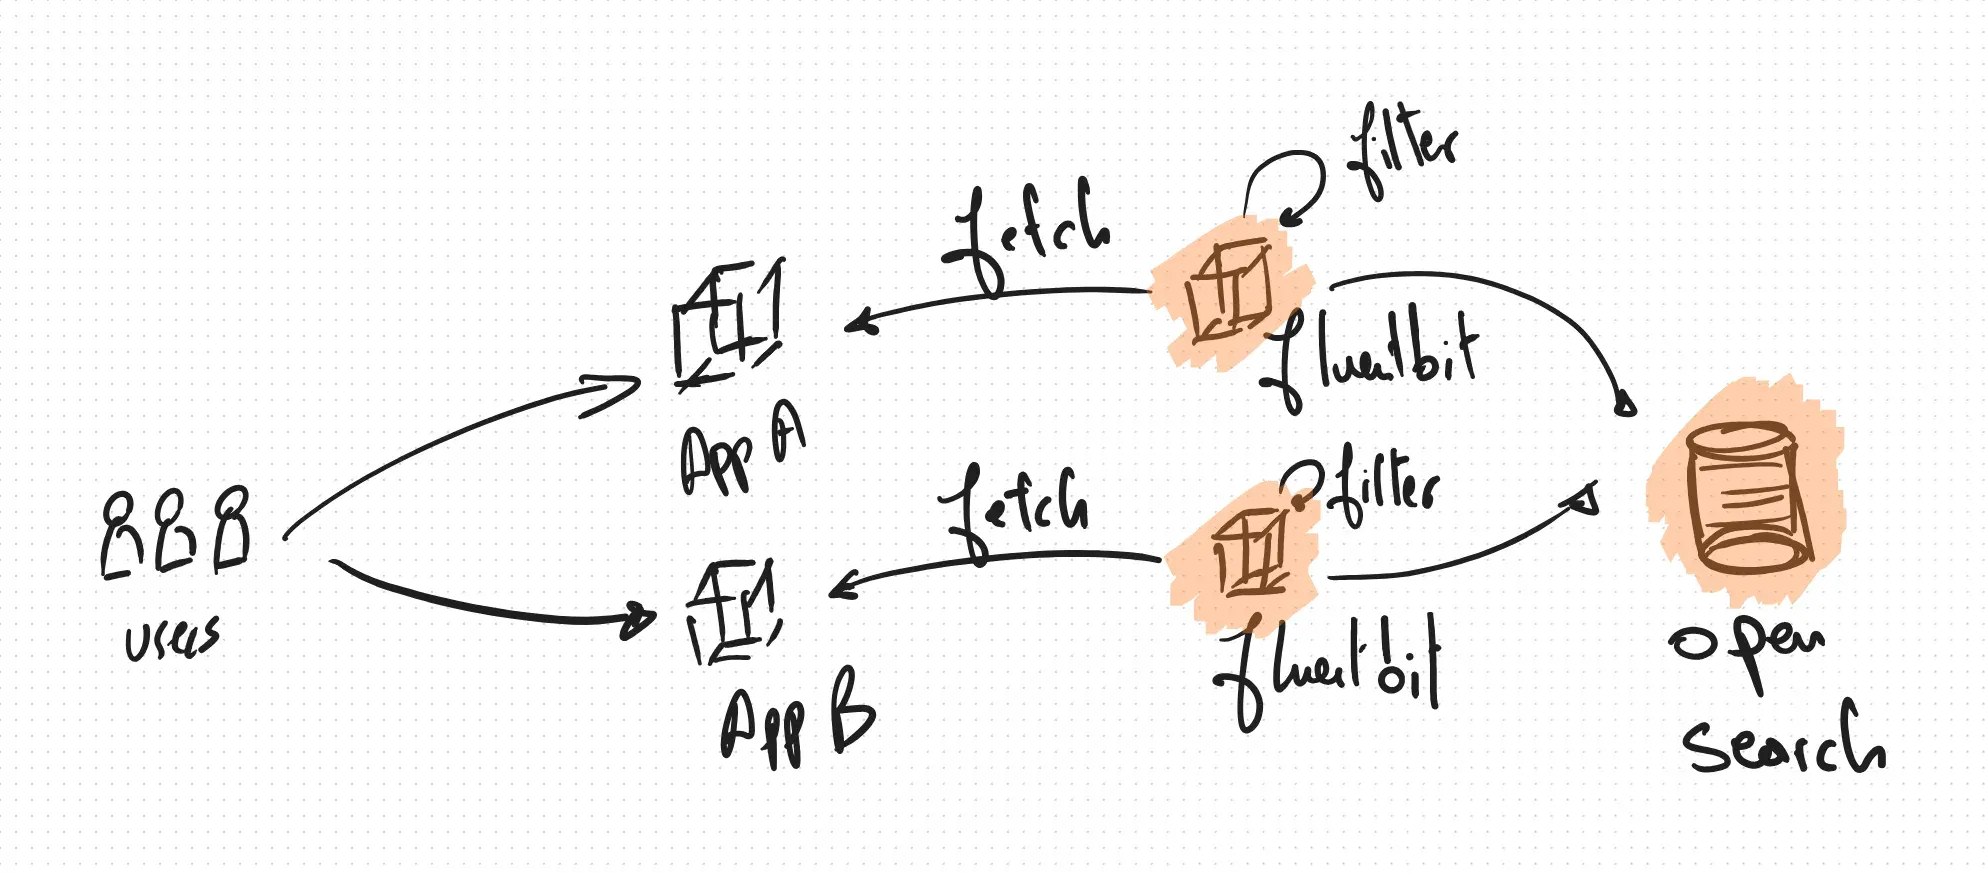
think of it like this:
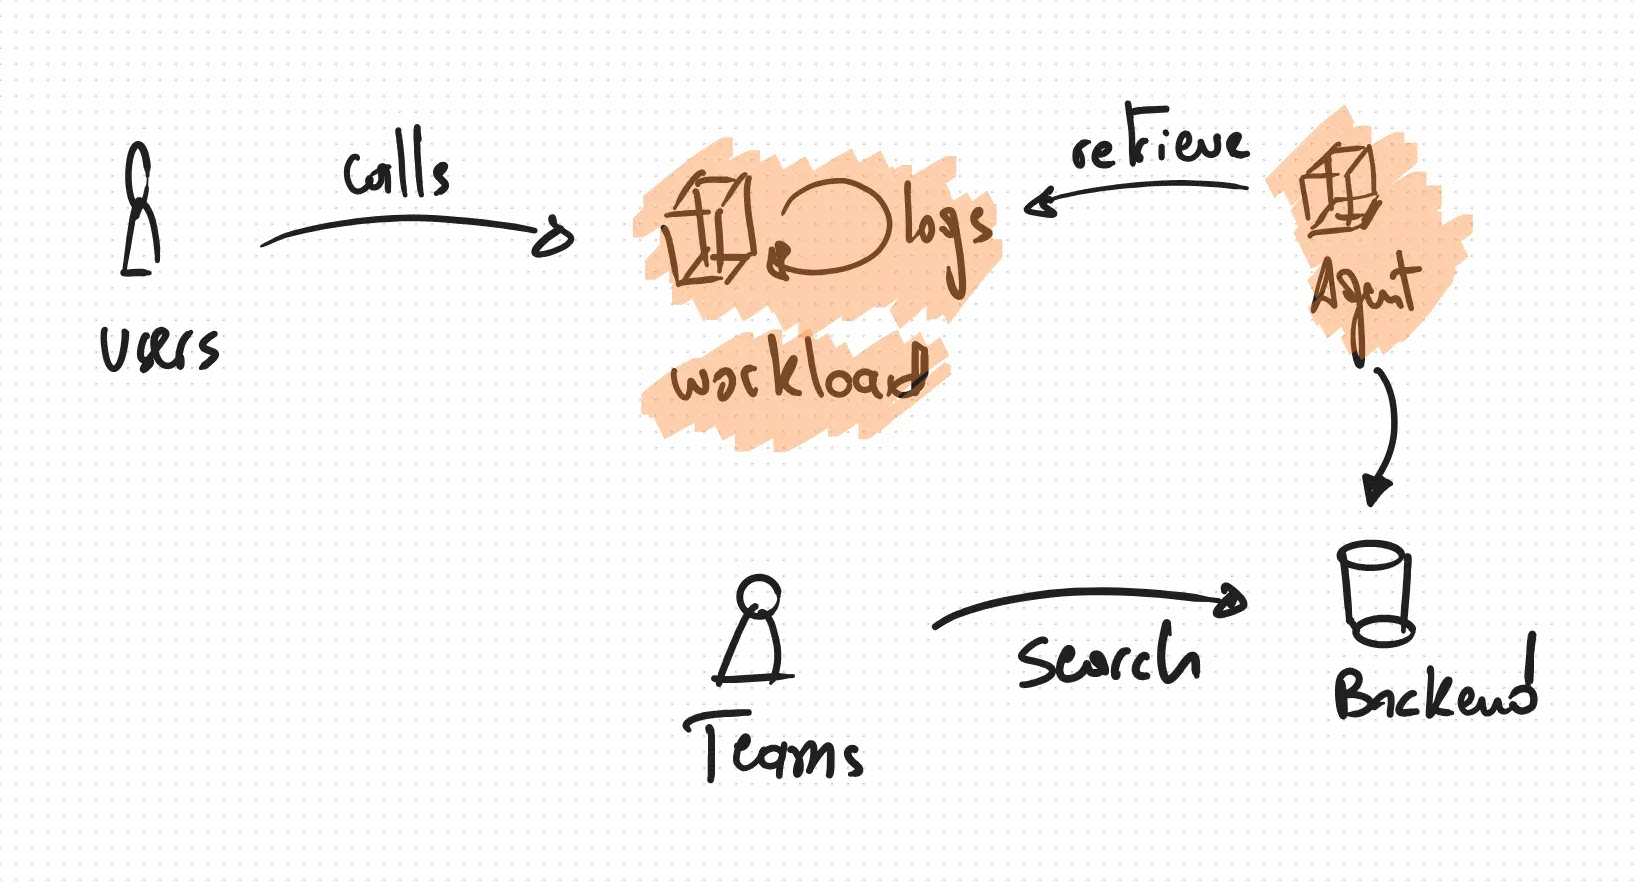
Where :
- users make queries against your workload
- each task generates structured logs
- agents fetch logs periodically (depends on configuration)
- agents given some tresholds push logs into a backend
- the backend is made available to teams for search & analysis purposes
Before diving into what agents are ? how to make such pipeline work in real world scenario, we need to have a close look at Opensearch, the final destination of our logs.
OpenSearch: a fork born from licensing changes
Congrats, you’re almost there, we’ll be trying to setup a fully working opensearch cluster, but few concepts should be explained beforehand, we’ll need to talk about index, shards, ISM policies, index templates and so on …etc.
OpenSearch is an open-source search and analytics suite that originated as a fork of Elasticsearch and Kibana. This forking event wasn’t due to technical disagreements in the traditional sense, but rather a response to a significant change in Elasticsearch’s licensing.
Here’s the breakdown:
-
elasticsearch’s original open source nature: Elasticsearch, when it first gained popularity, was licensed under the Apache 2.0 license. This is a permissive open-source license that allows users to freely use, modify, and distribute the software.
-
amazon’s involvement and managed service: Amazon Web Services (AWS) leveraged this open-source nature to create and offer a managed Elasticsearch service. While this benefited users, the company behind Elasticsearch (Elastic) felt that AWS was profiting significantly without contributing back to the open-source project in a way they deemed sufficient. There were also concerns about trademark usage (“Amazon Elasticsearch Service”).
-
the licensing shift: in early 2021, Elastic announced a change in the licensing of Elasticsearch and Kibana, starting with version 7.11. They adopted a dual-licensing model using the Server Side Public License (SSPL) and the Elastic License. These licenses are more restrictive than Apache 2.0, particularly concerning the offering of Elasticsearch as a managed service. The SSPL, for instance, requires that if you offer the software as a service, you must make the source code of your entire service available under the same license.
-
the fork and the birth of OpenSearch: this licensing change by Elastic was seen by some in the open-source community, including AWS, as a move away from true open source. In response, AWS decided to take the last fully Apache 2.0 licensed versions of Elasticsearch and Kibana (version 7.10.2) and create a new, truly open-source project: OpenSearch.
-
the goal of OpenSearch: the primary goal of OpenSearch was to provide a fully open-source alternative for search and analytics, governed by the Apache 2.0 license. This ensures that it remains free to use, modify, and distribute without the restrictions introduced by Elastic’s new licensing. The OpenSearch project is now governed by the OpenSearch Software Foundation, under the Linux Foundation, emphasizing its community-driven nature.
In essence, OpenSearch came into being because AWS and others wanted to ensure a continuation of a fully open-source search and analytics platform after Elastic changed its licensing model. Either it’s right or wrong, it’s up to you to decide.
Architecture
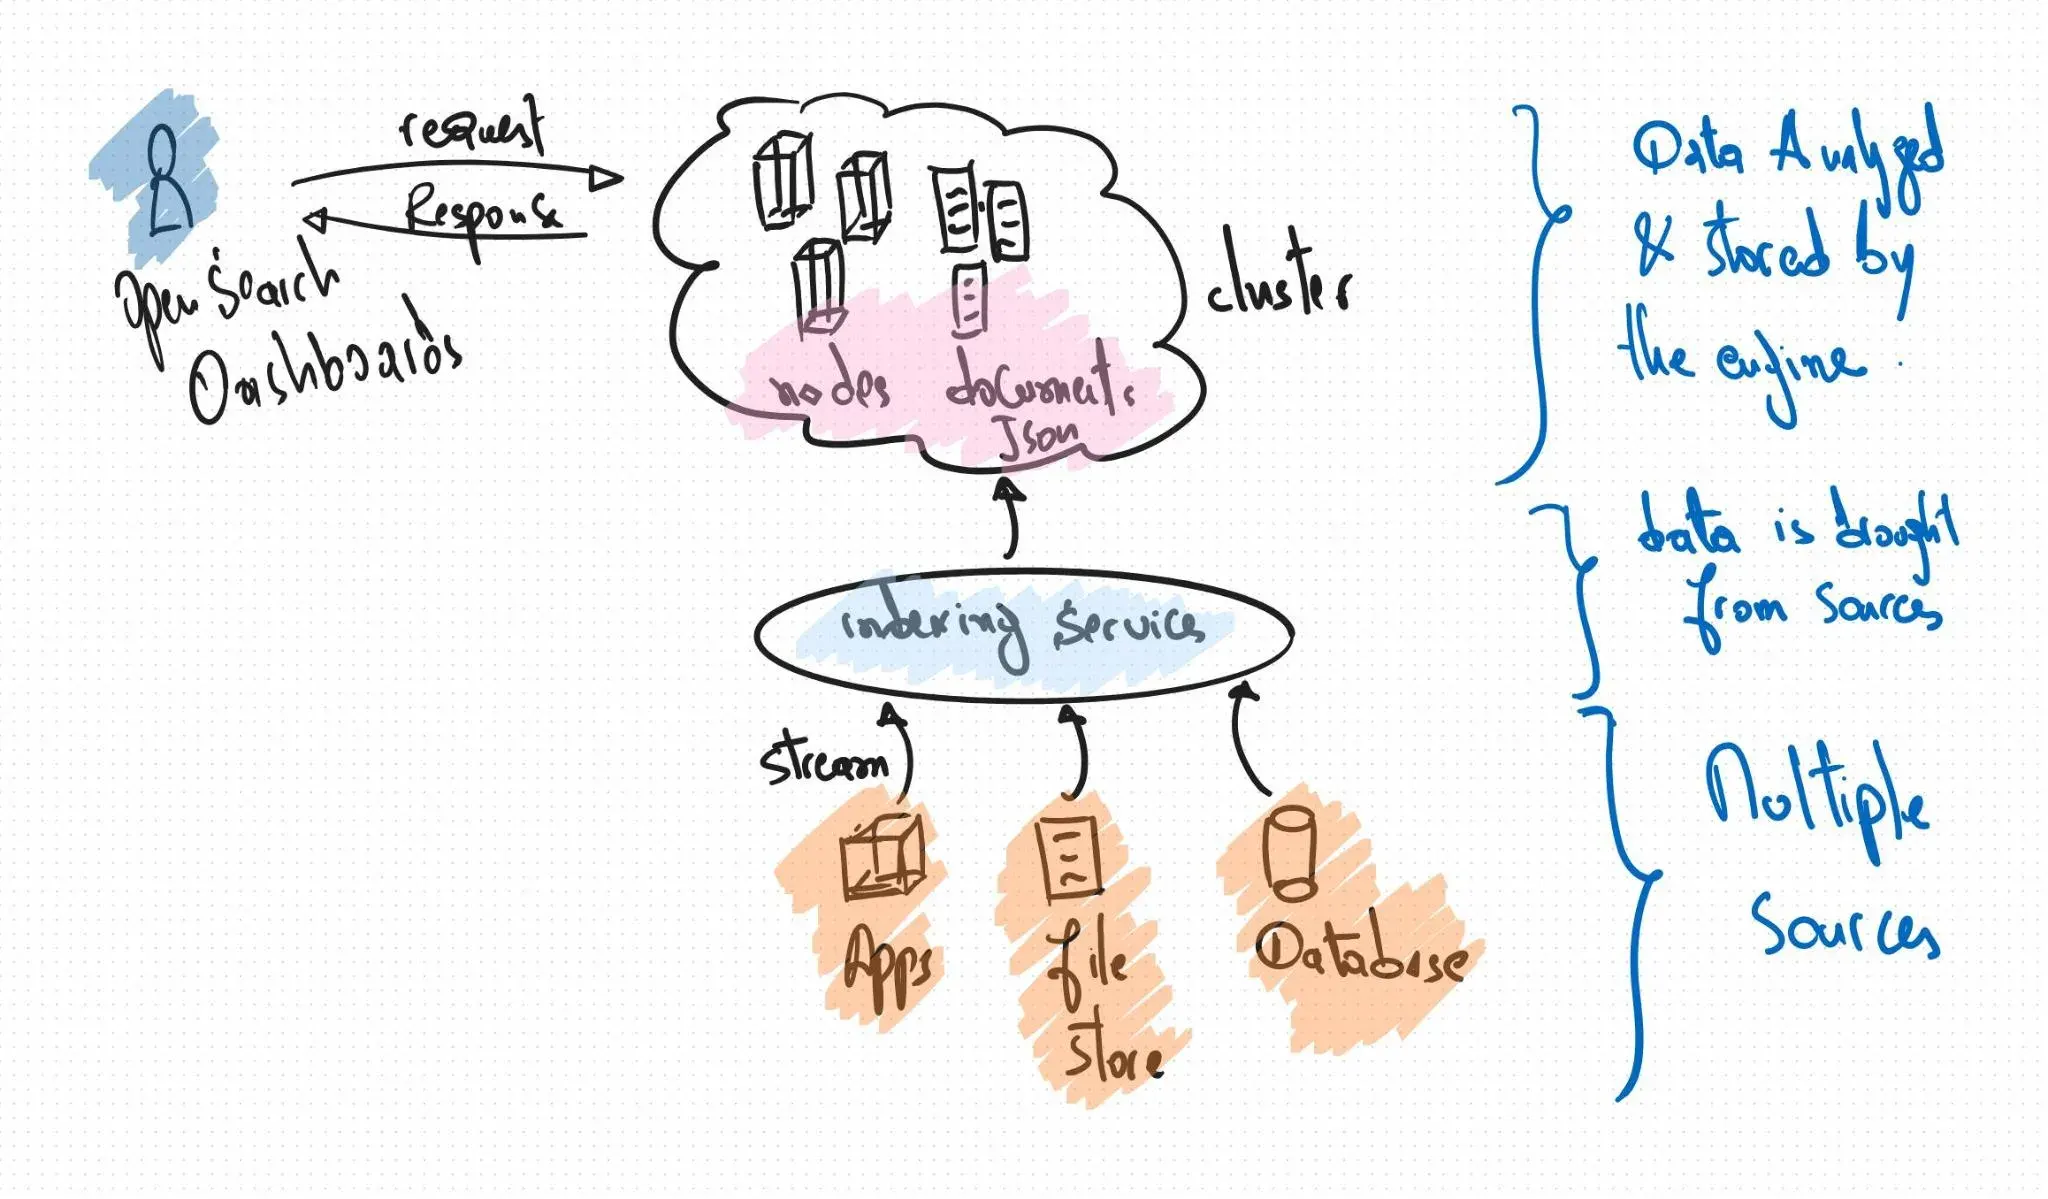
Openserarch has grown into a popular search engine with aggregations and analytics that serve various use cases (application monitoring, log data analytics, web app search functions, security event capturing, machine learning, and more). It is a performant, scalable, highly available and fault tolerance.
To achieve that, it’s based on a a high-performance, full-text searching library developed in Java called Apache Lucene well-known for its powerful searching and indexing features.
Indices
Similar to relational databases, Opensearch stores data on disk using optimized and compressed techniques using a higher construct called indices; containers that host any number of JSON documents, like a logical grouping composed of shards, that can be hosted on different nodes :
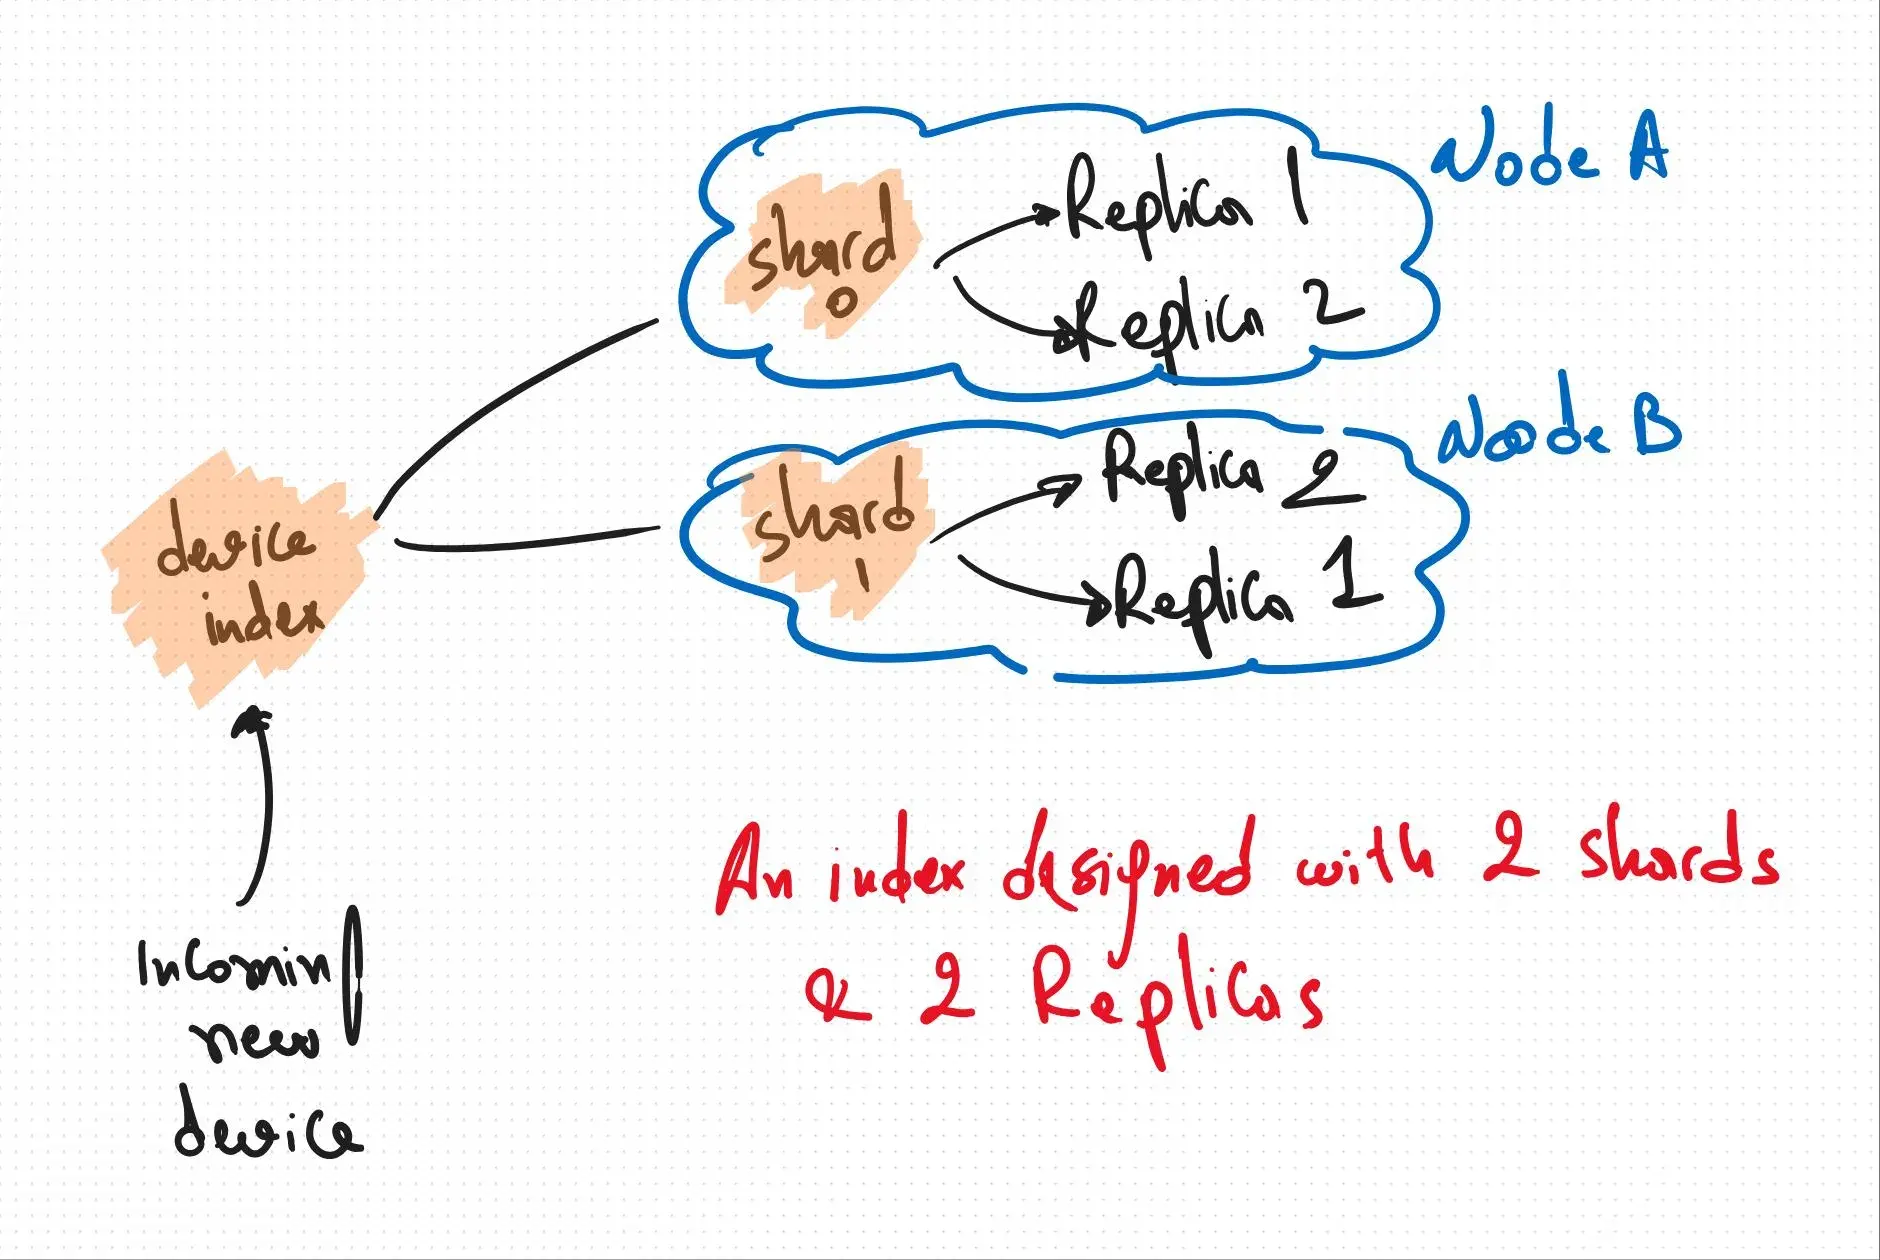
Shards
Shards are the physical instances of Apache Lucene, they take care of the physical storage and retrieval of our data. They are devided into one or more shards. For each shard, there can be one primary shard and zero or more replica shards. Here’s the key difference:
primary shard:
- write operations: all indexing (write) operations are first directed to the primary shard.
- read operations: primary shards can also serve read (search) requests.
- one per Shard: there is exactly one primary shard for each shard of an index.
- data authority: the primary shard is the authoritative source of data for its portion of the index.
- fixed number: the number of primary shards for an index is typically fixed at the time of index creation and cannot be easily changed later (it usually requires re-indexing).
replica shard:
- read operations: replica shards are primarily for serving read (search) requests. By having replicas, you can distribute the search load across multiple nodes, improving query performance and throughput.
- high availability: replicas provide redundancy. If a primary shard fails (e.g., due to node failure), a replica can be promoted to become the new primary, ensuring no data loss and continuous service.
- zero or more per primary: each primary shard can have zero or more replica shards.
- dynamic number: the number of replica shards can be changed at any time after the index is created without requiring re-indexing.
- copies of primary: replica shards are exact copies of the primary shard. OpenSearch automatically keeps them synchronized with the primary shard.
- different nodes: OpenSearch ensures that primary shards and their corresponding replica shards reside on different nodes within the cluster to enhance fault tolerance.
In simple words, think of the primary shard as the main copy where all changes are first made. Replica shards are backup copies that help with reading the data faster and ensuring the data is still available if the main copy has a problem.
If you wish to know more about the right size of your shards, have a look at this github repository, but keep in mind that disk space can grow fast, for instance take 3 shards and 10 replicas startegy, with each shard sized at 50GB:
- Shared disk space: 3 * 50GB/shard = 150GB
- Replica disk space: 10 * 50GB/shard = 500GB/per shard
- Replica disk space for 3 shards: 3 * 500GB/shard = 1500GB
- Total disk space for both shards and replicas on a given node: 150 GB + 500 GB = 650 GB
- Total for 10 nodes ~= 6.5 TB Just like that, 6.5TB for one index with 3 shards & 10 replicas, note that we need further disk space to run the cluster smoothly.
Cluster health logic
Opensearch (actually Elasticsearch) adopted a particular way of exposing cluster health, more like a traffic light system where:
- RED: the shards have not yet been assigned, so not all data is available for querying.
- YELLOW: replicas are not yet assigned, but all the shards have been assigned and are in action.
- GREEN: this is the happy state when all shards and replicas are assigned and serving as expected.
$ curl -s -u CHANGEME:CHANGEME \ -H 'Content-Type: application/json' https://YOUR_FQDN/_cluster/health | jq -r .status
greenTime series data
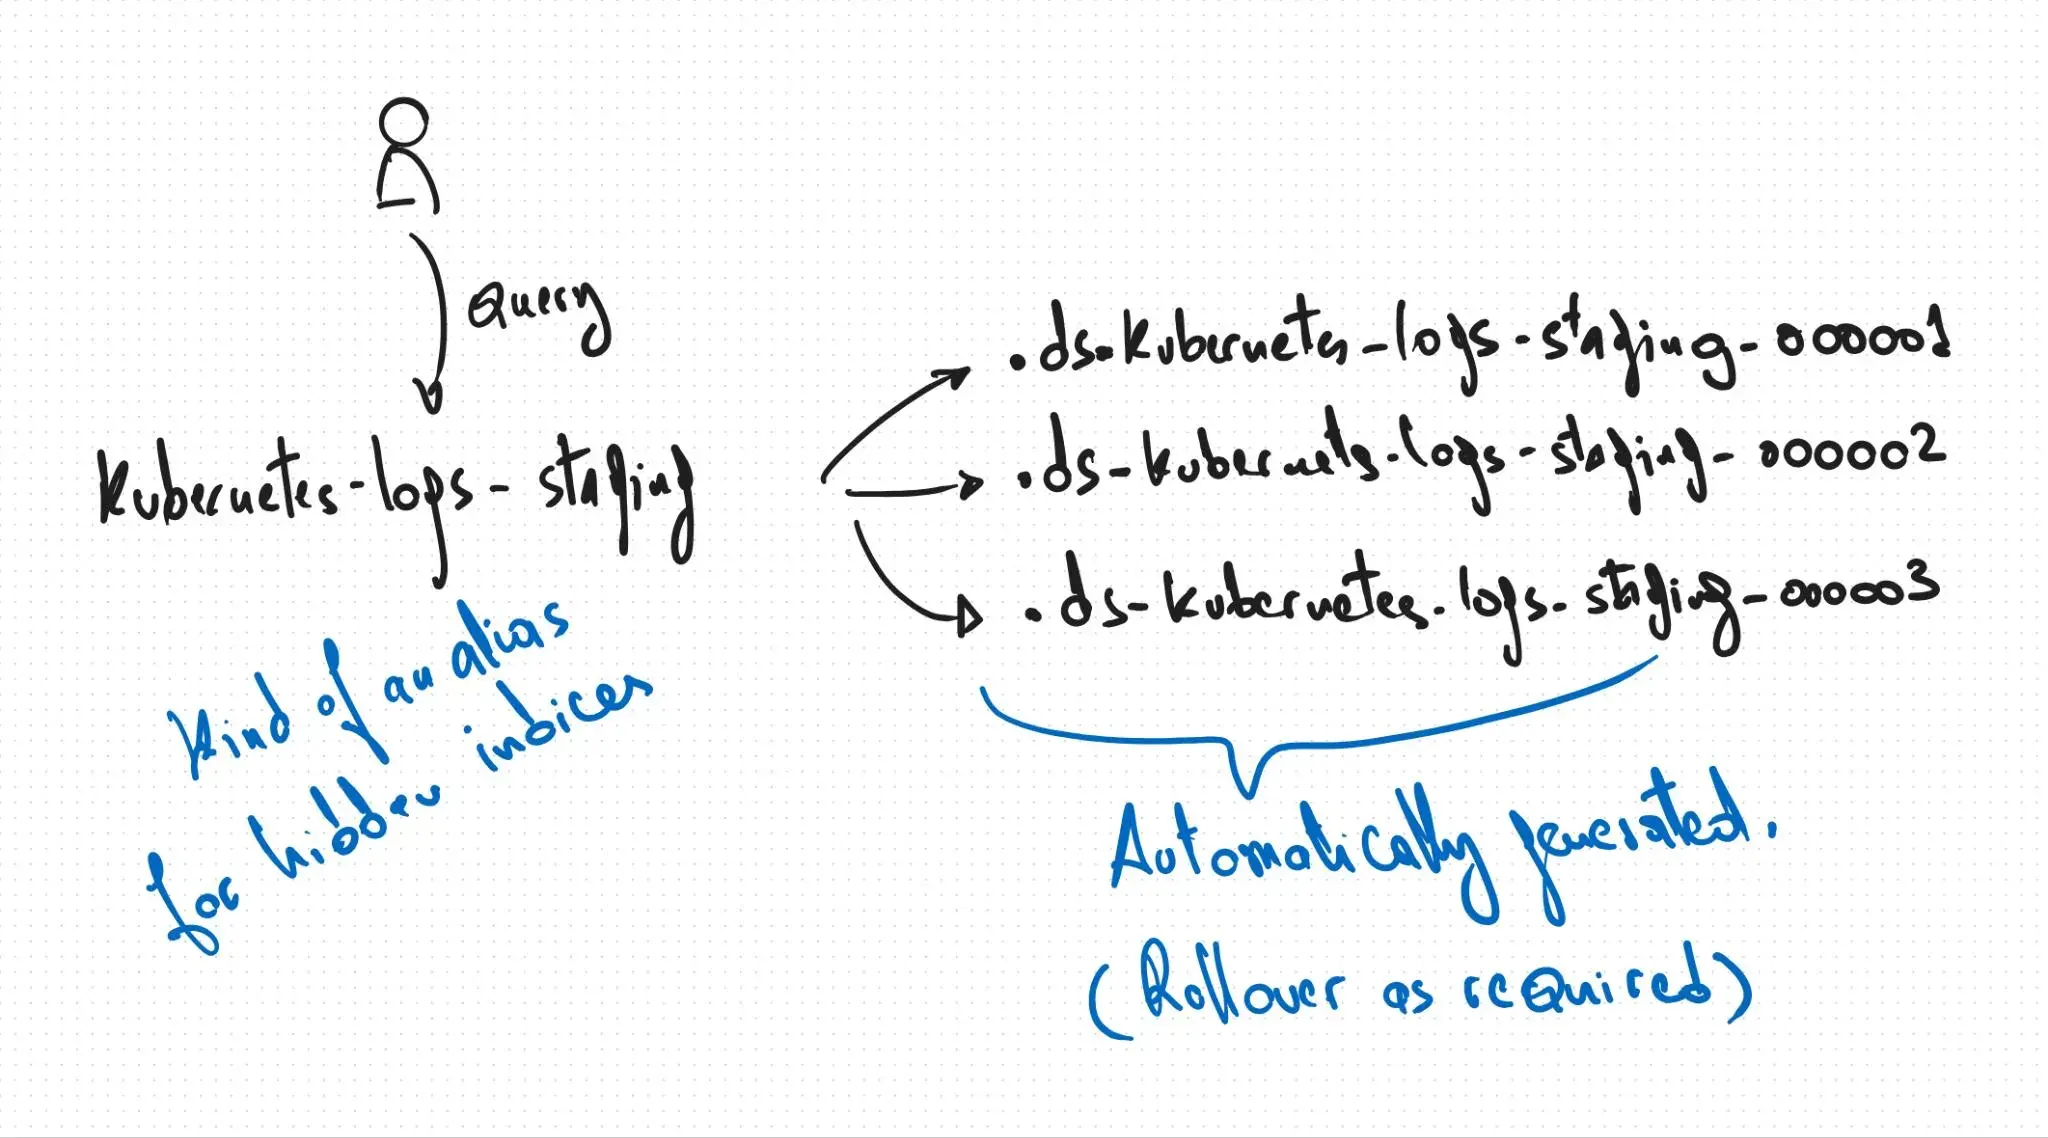
Promise this will be the last step before we can start the fun stuff, data streams let us store data in multiple indices but allow access to a single resource for search and analytical related queries. each data stream has a set of indices for each time point, they are auto generated by Opensearch.
It is suited for append only data with a strong emphasis on document’s timestamp field (mandatory).
You can create manually new data stream like this :
$ curl -s -u CHANGEME:CHANGEME \ -X PUT \ -H 'Content-Type: application/json' https://YOUR_FQDN/_data_stream/ kubernetes-logs-staging
# you can look for it$ curl -s -u CHANGEME:CHANGEME \ -H 'Content-Type: application/json' https://YOUR_FQDN/_data_stream | jq .{ "data_streams": [ { "name": "kubernetes-logs-staging", "timestamp_field": { "name": "@timestamp" }, "indices": [ { "index_name": ".ds-kubernetes-logs-staging-000001", "index_uuid": "WchmWHjESpiyapMDHxVMuw" } ], "generation": 1, "status": "GREEN", ... } ]}Index template
Each index have different attributes, like maximum number of fields, number of primary shards, replicas and so on, for instance one can create explicity an index like this:
# creating an index called kubernetes-staging-logs$ curl -s -u CHANGEME:CHANGEME \ -X PUT \ -H 'Content-Type: application/json' https://YOUR_FQDN/_data_stream/kubernetes-staging-logs \ -d '{ "settings":{ "number_of_shards":3, "number_of_replicas":10, "codec": "best_compression" }}'which is fine, but things get harder when we have to set the exact fields for all new indices. Hopefully we can use index template, based on a glob pattern we can predefine mappings, settings, and aliases bundled up in this template.
It’s true that you can either use a component template or a simple one, to keep things simple we’ll use the later one. Let’s for the sake of clarity create a simple index template called kubernetes-staging-logs that will catch all indices that follow the glob expression kubernetes-*-logs and set the number of replicas & primary shards :
# we're creating an index template called kubernetes-staging-logs$ curl -s -u CHANGEME:CHANGEME \ -X PUT \ -H 'Content-Type: application/json' https://YOUR_FQDN/_index_template/kubernetes-staging-logs \ -d ' { "index_patterns": ["kubernetes-*-logs"], "priority": 1, "template": { "settings":{ "number_of_shards":3, "number_of_replicas":10 } } }'ISM policy
Index State Management lets you automate these periodic, administrative operations by triggering them based on changes in the index age, index size, or number of documents. Using ISM policies, we cand automatically handle index rollovers or deletions to fit your use case.
Wondering why I’m talking about this ? Remember that an index can have as much as disk space can contain of JSON documents, in a real world setup, we need to rotate this indices by triggering rolling overs, roll ups, split it, merge it …etc.
To keep it simple, we’ll focus only on rollovers, it help copy documents to new index and make old index read-only, any new documents are indexed into this rolled-over index from now on.
# create an ISM policy that matches all indices that have# kubernetes-*-logs glob pattern that triggers when we have# 1 document and transition to alias state when we reach 2 documents.# the alias state removes alias called kubernetes-latest-log$ curl -s -u CHANGEME:CHANGEME \ -X PUT \ -H 'Content-Type: application/json' https://YOUR_FQDN/_plugins/_ism/policies/kubernetes-logs \ -d ' { "policy": { "description": "Kubernetes' rollover policy", "default_state": "rollover", "states": [ { "name": "rollover", "actions": [ { "rollover": { "min_doc_count": 1 } } ], "transitions": [{ "state_name": "alias", "conditions": { "min_doc_count": "2" } }] }, { "name": "alias", "actions": [ { "alias": { "actions": [ { "remove": { "alias": "kubernetes-latest-log" } } ] } } ] } ], "ism_template": { "index_patterns": ["kubernetes-*-logs"], "priority": 100 } } }'Setup
This is an advanced subject and few aspects were omitted like provisioning a Kubernetes cluster, setup ingress controllers ..etc. I tried to keep things straight forward
At last ! We have all the building blocks to start our setup with a firm grasp, we’ll be using a cloud native approach on a Kubernetes cluster using OpenSearch operator, basically our cluster will be shaped like this:
- 5 data nodes: nodes responsable of ingesting and holding data
- 3 masters: manage the cluster state. Think of them as the central control and coordination point for the entire cluster.
- 2 coordinators: act as a request router and result aggregator. They sit between the clients and the data nodes.
Let’s start the fun part:
-
add opensearch’s operator helm repository:
Terminal window $ helm repo add opensearch-operator https://opensearch-project.github.io/opensearch-k8s-operator/$ helm repo up -
create a custom opensearch.operator.values.yml file that fits your needs
-
install opensearch cluster against your kubernetes cluster
Terminal window $ helm install opensearch-production opensearch-operator/opensearch-operator --version 2.7.0 --values opensearch.operator.values.yml --namespace logging --create-namespaceremember we’ll be deploying a production grade setup, meaning the security plugin will be enabled and for that we need the intial configuration that you can find in security.config.yml:
Terminal window # please have a look at the file, I used some default values;# OIDC is enabled with basic auth for admin user# if you don't have an IDP, feel free to remove it$ k -n logging apply -f security.config.ymlthen install OpenSearchCluster Custom Resource using opensearch.cluster.yml:
Terminal window $ k -n logging apply -f opensearch.cluster.yml# wait a little bit and then$ k -n logging get po --template='{{ range .item }}{{ .metadata.name }}{{ "n" }}{{ end }}'production-logs-cluster-coordinators-0production-logs-cluster-coordinators-1production-logs-cluster-dashboards-5f8df558cc-5l8mmproduction-logs-cluster-dashboards-5f8df558cc-wjf48production-logs-cluster-data-0production-logs-cluster-data-1production-logs-cluster-data-2production-logs-cluster-data-3production-logs-cluster-data-4production-logs-cluster-masters-0production-logs-cluster-masters-1production-logs-cluster-masters-2devops-opensearch-operator-controller-manager-5f848d4dbd-6gh4q
💡 Careful about a weird behavior, according to the official documentation to have a coordinator node we need to set roles attribute to an empty array ([]), but doing this makes the operator set all possible roles to these nodes (cluster_manager, data, ingest, remote_cluster_client) which can be somehow error prone if your shards end up on these nodes.
Make sure all of your nodes have the intended role(s):
$ curl -s -u CHANGEME:CHANGEME \ -H 'Content-Type: application/json' \ 'https://YOUR_FQDN/_cat/nodes?h=name,node.role,node.roles&pretty'
production-logs-cluster-masters-0 m cluster_managerproduction-logs-cluster-data-0 di data,ingestproduction-logs-cluster-coordinators-0 - -production-logs-cluster-data-2 di data,ingestproduction-logs-cluster-data-4 di data,ingestproduction-logs-cluster-masters-2 m cluster_managerproduction-logs-cluster-masters-1 m cluster_managerproduction-logs-cluster-coordinators-1 - -production-logs-cluster-data-1 di data,ingestproduction-logs-cluster-data-3 di data,ingestto sum up we need to create a user to be used by our agent to push data into our data stream, we’ll be using a combinason of OpenSearchUser, OpenSearchRole & OpenSearchUserRoleBinding Custom Resources using opensearch.rbac.yml
$ k -n logging apply -f opensearch.rbac.yml
# check the created account$ curl -s -u CHANGEME:CHANGEME \ -H 'Content-Type: application/json' \ https://YOUR_FQDN/_plugins/_security/api/internalusers?pretty
{ "fluentbit" : { "hash" : "", "reserved" : false, "hidden" : false, "backend_roles" : [ ], "attributes" : { "description" : "fluentbit's own service account to push logs into data streams", "k8s-uid" : "3d51a829-6686-4a90-891f-0d0652de534c", "purpose" : "logs", "scope" : "staging", "team" : "devops" }, "opendistro_security_roles" : [ ], "static" : false } }So far so good, we have a working cluster that waits for data, before we can send anything we’ll need to create a receiving data stream, we’ll call it kubernetes-staging-logs, this index should have 2 primary shards & 2 replicas (for the sake of the example), we’ll be using OpensearchIndexTemplate Custom Resource (index.template.yml):
# catch with glob expression all kubernetes-staging-* data streams# to setup general settings automatically$ k -n logging apply -f index.template.yml
# create a data stream called kubernetes-logs-staging$ curl -s -u CHANGEME:CHANGEME \ -X PUT \ -H 'Content-Type: application/json' https://YOUR_FQDN/_data_stream/ kubernetes-staging-logs
# check your newly create data stream# look at all settings that were set automatically for you$ curl -s -u CHANGEME:CHANGEME \ -H 'Content-Type: application/json' https://YOUR_FQDN/kubernetes-staging-logs/_settings | jq .
{ ".ds-kubernetes-staging-logs-000001": { "settings": { "index": { "replication": { "type": "DOCUMENT" }, "codec": "best_compression", "mapping": { "total_fields": { "limit": "2000" } }, "refresh_interval": "1s", "hidden": "true", "number_of_shards": "2", "provided_name": ".ds-kubernetes-staging-logs-000001", "creation_date": "1747757889235", "number_of_replicas": "2", "uuid": "5rq-d2iETrGpeHlJ2AknSw", "version": { "created": "136407927" } } } } }The last step of this process is to create an ISM policy to rollover our data streams and delete data at some point (depends on your needs and your configuration), to keep it simple, we’ll say that all indices that exceed 50Gb for a primary shard or 1 day of logs will be rolled over, we’ll also delete old indices that are older that 1 week, you can find all of this in ism.policy.yml:
$ k -n logging apply -f ism.policy.yml
# check the created policy$ curl -s -u CHANGEME:CHANGEME \ -H 'Content-Type: application/json' https://YOUR_FQDN/_opendistro/_ism/policies | jq . { "policies": [ { "_id": "kubernetes-logs", "_seq_no": 214605, "_primary_term": 6, "policy": { "policy_id": "kubernetes-logs", "description": "ISM policy that rollover all kubernetes logs' indices that exceed timely\n& size tresholds", "last_updated_time": 1747896996921, "schema_version": 21, "default_state": "hot", "states": [ { "name": "hot", "actions": [ { "retry": { "count": 3, "backoff": "exponential", "delay": "1m" }, "rollover": { "min_index_age": "1d", "min_primary_shard_size": "50gb", "copy_alias": false } } ], "transitions": [ { "state_name": "delete", "conditions": { "min_index_age": "7d" } } ] }, { "name": "delete", "actions": [ { "retry": { "count": 3, "backoff": "exponential", "delay": "1m" }, "delete": {} } ], "transitions": [] } ], "ism_template": [ { "index_patterns": [ "kubernetes-staging-*", ], "priority": 100, "last_updated_time": 1747896996921 } ] } } ], "total_policies": 1 }Now we can talk about agents and how to push data into our lovely opensearch cluster !
Agents:
Agents are workloads that collect logs from targets in near real-time and send them to various backends. The specific backend choice depends on the solution being used. Within the CNCF ecosystem, we have several options available, and I personally prefer using :
Logstash
server-side data processing pipeline that ingests data from a multitude of sources, transforms it, and then sends it to your favorite backend, more often used with Elastic search.
Promtail
Easy to use and straight forward, kind of related to Grafana’s umbrella, you’ll need to use Loki.
FluentD & Fluentbit
Both work as aggregators or forwarders and can complement each other or be used as standalone solutions. Even though lately we fluentbit is considered more the next-generation solution, let’s have a quick comparaion (https://docs.fluentbit.io/manual/about/fluentd-and-fluent-bit) :
| Feature | FluentD | Fluentbit |
|---|---|---|
| scope | $Containers / Servers | Embedded Linux / Containers / Servers |
| language | C & Ruby | C |
| memory | Greater than 60 MB | Approximately 1 MB |
| performance | Medium Performance | High Performance |
| dependencies | Built as a Ruby Gem, depends on other gems. | Zero dependencies, unless required by a plugin. |
| plugins | Over 1,000 external plugins available. | Over 100 built-in plugins available. |
| license | Apache License v2.0 | Apache License v2.0 |
In our case we’ll be running Fluentbit for its large number of input/output plugins and its performance, using fluentbit.values.yml
$ helm repo add fluent https://fluent.github.io/helm-charts$ helm repo up$ helm --kubeconfig YOUR_KUBE_CONFIG_FILE \ install devops-helm fluent/fluent-bit \ --version=0.49.0 --values fluentbit.values.ymlIn a nutshell, here, we use tail plugin to watch kubernetes logs files /var/log/containers/*.log combined with three filters:
-
kubernetes: tags that have prefix kube.var.log.containers. and have log key will be enriched and merged into new key called devops_log, note that will keep old _log key also (feel free to remove it)
-
grep: remove logs coming from namespaces like default, kube-system & node-lease
-
lua: this filter is special, it uses an inline lua script to process log lines that can cause few issues, for instance take these two workloads, where one have this label:
# app Alabels:app.kubernetes.io/name: awesomeand the other have this:
# app Blabels:app: uglyOpensearch will treat the first label as nested object, A.K.A app[“kubernetes”][“io”] but the second label tells it that the type is string, which will cause an exception as mapping differs. To fix this we call
sanitizefunction.
At this stage we successfully created this :